
Cashback Rates by Category, 2026
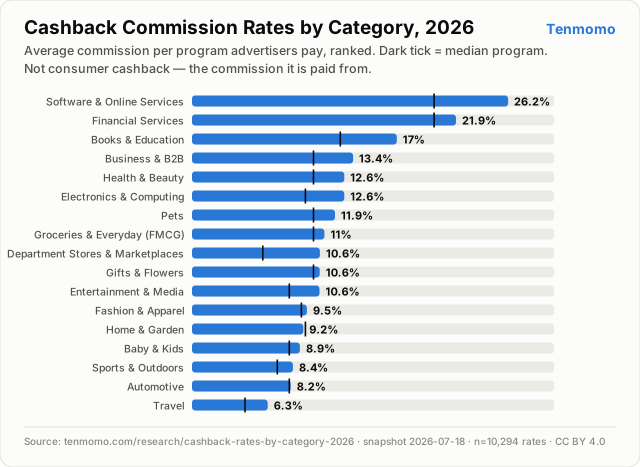
What commission rate do advertisers actually pay across affiliate programs? We pulled 10,294 live commission rates from 3,349 programs across four affiliate networks and ranked them by category. The spread is large — and the categories people shop most are near the bottom.
Store guides across categories
Key findings
- The average program pays a commission of about 6.27% (Travel) up to 26.2% (Software & Online Services) by category — roughly a 4× spread. We count each program once (see why below).
- Digital categories pay the most. Software & Online Services (26.2% per program), Financial Services (21.88%) and Books & Education (16.97%) lead the table.
- The everyday categories pay the least. Travel, Automotive and Sports & Outdoors sit at the floor (about 6.27–8.36% per program) — despite carrying some of the largest program counts.
- Averaging every rate line can mislead. Department Stores & Marketplaces looks like it pays 27.65% if you average all its commission tiers — but a typical program there pays just 10.6%, because a few marketplaces list hundreds of high per-department tiers. We rank each category by its per-program average for exactly this reason.
- The same category pays differently by network. Business & B2B spreads about 2.94× between its highest- and lowest-paying network; several categories show 2–3× gaps.
- Fixed-fee bounties are a separate slice. 791 programs pay a flat amount instead of a percentage (median 7 in native currency), skewed toward lead generation and software sign-ups.
Commission rate by category
Ranked by the average commission a typical program pays (each program counted once). The dark tick marks the per-program median.
Full data table
All 17 categories with n ≥ 30 rate lines. Per-program avg weights each program once (the ranking metric); rate-line avg averages every commission tier. Categories below 30 rate lines fold into an unpublished residual.
| Category | Programs | Per-program avg | Per-program median | Rate-line avg | Rate-line median | Rate lines | Typical range (p25–p75) |
|---|---|---|---|---|---|---|---|
| Software & Online Services | 76 | 26.2% | 20% | 28.28% | 25% | 214 | 15%–38.75% |
| Financial Services | 21 | 21.88% | 20% | 25.1% | 20% | 34 | 10%–46.75% |
| Books & Education | 83 | 16.97% | 12.22% | 13.51% | 9% | 164 | 8%–20% |
| Business & B2B | 117 | 13.35% | 10% | 10.08% | 5% | 255 | 2%–15% |
| Health & Beauty | 621 | 12.62% | 10% | 11.41% | 10% | 1,091 | 5%–15% |
| Electronics & Computing | 334 | 12.62% | 9.33% | 10.88% | 6% | 951 | 5%–10% |
| Pets | 42 | 11.85% | 10% | 10.77% | 10% | 62 | 5.5%–15% |
| Groceries & Everyday (FMCG) | 127 | 10.97% | 10% | 12.18% | 10% | 212 | 5%–15% |
| Department Stores & Marketplaces | 34 | 10.6% | 5.8% | 27.65% | 19% | 268 | 5%–42% |
| Gifts & Flowers | 121 | 10.58% | 10% | 10.13% | 10% | 250 | 6%–12% |
| Entertainment & Media | 148 | 10.57% | 8% | 8.06% | 5% | 351 | 3%–10% |
| Fashion & Apparel | 624 | 9.52% | 9% | 4.88% | 4% | 4,439 | 2%–6% |
| Home & Garden | 519 | 9.22% | 9.33% | 8.72% | 8% | 875 | 5%–10% |
| Baby & Kids | 39 | 8.94% | 8% | 8.93% | 8% | 66 | 6%–10% |
| Sports & Outdoors | 150 | 8.36% | 7% | 8.02% | 6% | 229 | 5%–10% |
| Automotive | 95 | 8.18% | 8% | 7.87% | 7% | 136 | 5%–10% |
| Travel | 162 | 6.27% | 4.33% | 4.82% | 4% | 653 | 2%–6% |
| All categories | 3,313 | — | — | 8.43% | 5% | 10,250 | 3%–10% |
How wide is each category?
Each box spans the middle 50% of that category's individual rate lines (p25–p75); the dark line is the rate-line median; the thin whisker runs to the minimum and maximum. This is the spread the per-program ranking smooths out — a category can have a modest typical program but a long tail of high-commission tiers.
Same category, different network
Where a category has 30+ rate lines on more than one network, the average rate line can differ sharply — the cashback site's choice of network changes the underlying economics. Ordered by the size of the gap.
Reading the extremes
Browse cashback by category
These figures are the commission rates advertisers pay — browse the live cashback stores we track in each shopping category:
Fixed-fee bounties
Separate from percentage rates, 791 programs pay a flat amount per conversion (native currency, predominantly USD — indicative only, not currency-normalized). These cluster in lead-gen and sign-up categories.
| Category | Rate lines | Median | Mean | Typical range |
|---|---|---|---|---|
| Books & Education | 38 | 38.5 | 48.82 | 20–80 |
| Electronics & Computing | 56 | 32.5 | 40.29 | 5–60 |
| Software & Online Services | 89 | 20 | 42.18 | 5–59.97 |
| Financial Services | 35 | 10 | 26.86 | 5–49 |
| Health & Beauty | 40 | 10 | 20.7 | 4.75–32.5 |
| Travel | 61 | 8 | 19.23 | 5–20 |
| Business & B2B | 278 | 7 | 12 | 7–7 |
| Entertainment & Media | 82 | 4 | 4.82 | 1.13–7 |
Methodology
- Source. A one-time, read-only pull on 2026-07-18 from our own affiliate data warehouse — the publisher-API data we hold as a member of four networks (Awin, CJ, Rakuten, Impact). 13,939 commission rows in total.
- These are commission rates, not consumer cashback. Every figure is what an advertiser pays the affiliate program — the percentage of an order (or flat fee) the program earns.
- Ranked by the per-program average. Networks list wildly different numbers of rate tiers per program (a single marketplace can list hundreds). Averaging every tier would let a few many-tier programs dominate a category, so we average within each program first, then across programs. Rate-line stats are shown alongside.
- Percent rates only (primary). We analyze 10,294 percentage-based rates. A percentage is unitless, so it's comparable across networks and currencies. Fixed fees are reported separately; 0 cost-per-click / per-mille rows are excluded.
- Zero-rate carve-outs removed. 2,548 percent rows paying 0% are excluded — product/category carve-outs (a program earning nothing on specific items), not representative commission rates.
- Minimum sample. Every published cell — each category, and each network within a category — needs 30+ rate lines. Categories below that fold into an unpublished residual (44 rate lines). Impact carries no category on its programs and is excluded from category stats.
- Robustness. Re-ranking on active programs only, with the same per-program metric, leaves the top three and bottom two categories unchanged — the ordering isn't an artifact of stale programs. Percentiles use linear interpolation.
- Reproducible. The category normalization and the aggregation script are in our repo; the exact figures on this page are the downloadable JSON dataset.
FAQ
Are these the cashback rates I get as a shopper?
No. These are the commission rates advertisers pay affiliate programs — the pool that cashback is paid out from. A shopper receives a share of this commission back; the exact share depends on the cashback site. This study measures the underlying commission advertisers pay, not consumer cashback.
Where does the data come from?
The rates are pulled directly from the publisher APIs of four affiliate networks (Awin, CJ, Rakuten, Impact) as a one-time snapshot on 2026-07-18. It covers 10,294 positive percentage-based commission rates across 3,349 programs. Nothing is scraped or estimated.
Why rank by a per-program average instead of the plain mean?
Some programs — marketplaces and catalogs on CJ in particular — expose hundreds of separate commission tiers (one per department or product list). Counting every tier equally would let a handful of programs dominate a category. So the ranking uses the average of each program first (each program counted once); we still show the rate-line mean and the full distribution beside it.
Which category pays the most, and the least?
Software & Online Services pays the most — about 26.2% per program (median 20%). Travel pays the least — about 6.27% per program — despite carrying one of the largest program counts.
How often is this updated?
This is a fixed snapshot dated 2026-07-18. Commission terms change as advertiser contracts change, so the figures drift over time. We re-snapshot periodically rather than editing this dataset in place, and date every version.
Cite & embed
Cite this study
Embed the summary card
Paste this to embed the chart with a link back:
Raw data: JSON dataset · License: CC BY 4.0 (link back to this page).

Software & Online Services — 26.2% per program
Hosting, SaaS and online-service programs pay the richest commissions (per-program median 20%). It's why creators push these deals so hard — the underlying payout is several times a typical retail category.
Department Stores & Marketplaces — 10.6% per program
Average every rate line and it looks like 27.65% — but a typical program pays only 10.6% (median 5.8%). A few marketplaces list hundreds of high per-department tiers. The textbook case for ranking per program.
Fashion & Apparel — 9.52% per program
The opposite skew: CJ lists 3,726 low apparel tiers that drag the rate-line average down to 4.88%, but a typical apparel program actually pays 9.52%.
Travel — 6.27% per program
Despite big-ticket bookings, travel pays the thinnest commissions (rate-line median 4%). A high-price flight through a cashback link earns proportionally little — the rate, not the basket, caps it.